G14: A Stable, High-Yielding, and Nutrient-Rich Red Sorghum Genotype for Diverse Agro-Climatic Zones of Tamil Nadu
G14 emerged as the most stable and high-yielding red sorghum genotype with superior nutritional traits, making it ideal for cultivation across diverse environments in Tamil Nadu.
Keywords: G × E interaction, Multi-trait selection index, Red sorghum, Stability
Red sorghum, known for its nutritional and biochemical richness, was assessed across 27 genotypes in diverse environments of Tamil Nadu to identify high-yielding and nutritionally superior varieties. The study emphasized the importance of yield stability over mean yield due to significant genotype-by-environment interactions (GEIs), which were evaluated using AMMI and GGE biplot models. Analysis revealed substantial genetic variability, with genotypic effects accounting for 50.2% of yield variation. Correlation studies showed panicle weight positively influenced grain yield, while micronutrient levels, particularly Fe and Zn, were negatively correlated with yield, underscoring the challenge of breeding for multiple traits simultaneously. Environment E2 was identified as highly discriminative for grain yield, with genotypes G11, G6, G9, and G14 showing strong performance. Notably, G9 and G14 exceeded the check variety PAIYUR 2 by up to 36.16%.
Multi-trait stability analyses using MTSI, MGIDI, FAI-BLUP, MTMPS, and the Smith-Hazel index confirmed G14 as the most stable and high-performing genotype across all traits and environments. Genotypes G14, G18, G21, and G26 exhibited both broad adaptability and elevated micronutrient levels, making them suitable for biofortified crop development. G21 and G26 were especially rich in Fe and Zn, while G11 showed the highest grain yield. Selection indices and biplot analyses further supported G14’s superior stability, yield, and mineral content. These results position G14 as a promising candidate for varietal release, hybrid development, and ideotype breeding, with strong potential to enhance food and nutritional security across agroecological zones in Tamil Nadu.
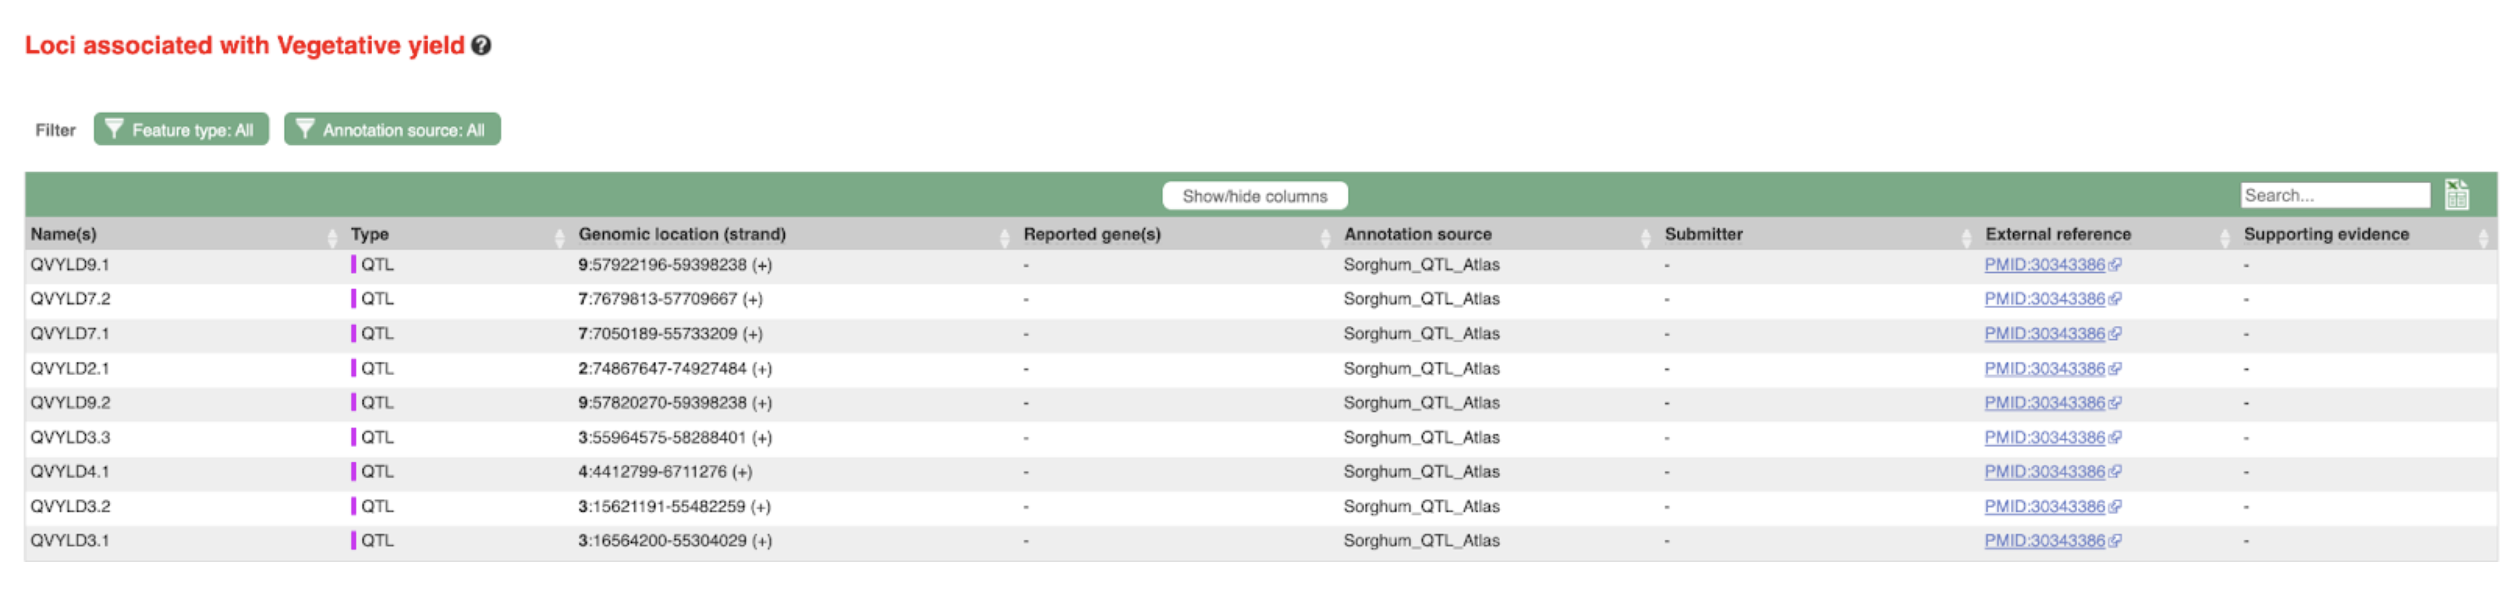
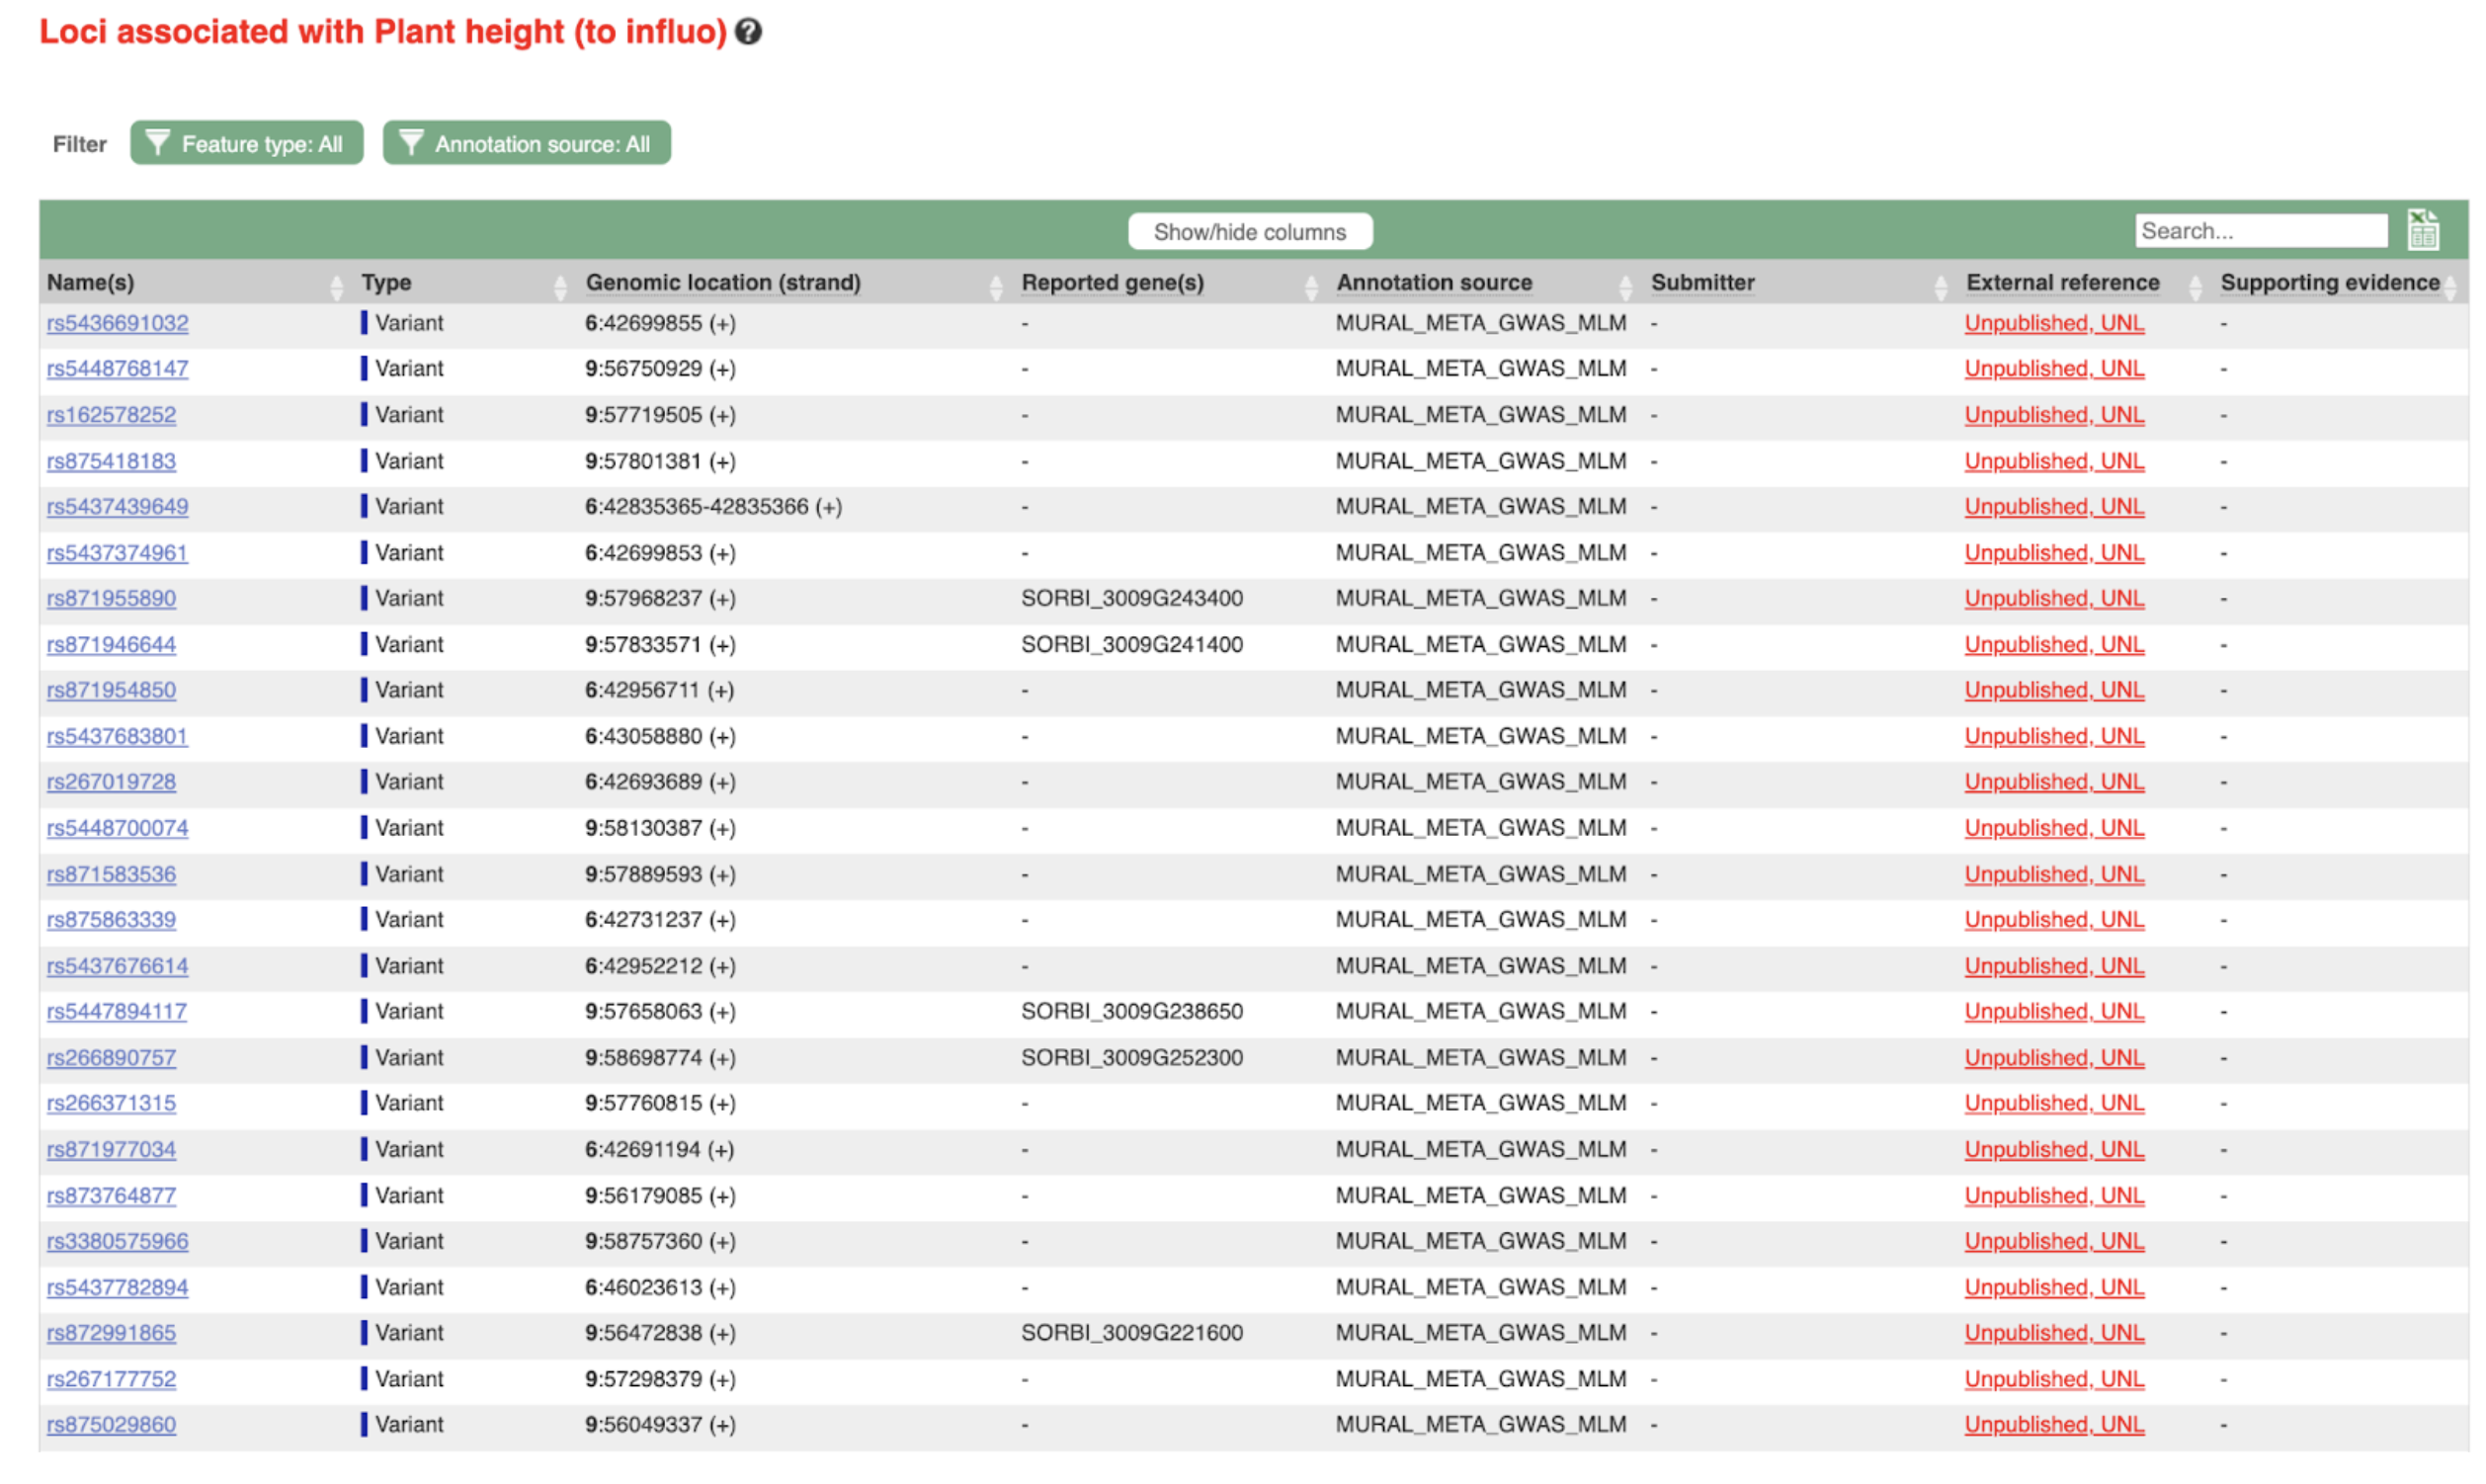
SorghumBase examples:

Reference:
Rajesh-Kumar S, Anand G, Narayanan SL, Subramanian E, Mini ML. Delineation of genotype × environment interaction and identifying superior red sorghum [Sorghum bicolor L. Moench] genotypes via multi-trait-based stability selection methods. BMC Plant Biol. 2025 Mar 4;25(1):283. PMID: 40038592. doi: 10.1186/s12870-025-06188-4. Read more
